

Educational Inequalities
by Jacob Yu
When I ran as an LAUSD student board member, I became more fully aware of the issues that deeply affect our district. When I attended the Student Superintendent Council Board meeting, many student representatives voiced their dissent and noted the racial and economic inequality within LAUSD. Listening to their complaints and concerns, I was inspired to research and continue exploring the issue of educational inequality in our school district. My continued interest and sparked passion from this event led me to produce this research article, which analyzes the history and roots of LAUSD educational inequality.
In the 1980s, Rodriguez vs. LAUSD was a court case started by Mexican American parents who noticed unequal educational treatment in their schools and towards their students. Mexican American community schools within LAUSD had subpar facilities, insufficient resources compared to White students, less money spent per student in comparison to wealthier White students, larger classroom sizes, and less qualified teachers. All of the aforementioned factors had a direct effect on the academic performance of students who attended these schools, with students attending primarily Hispanic schools scoring significantly lower in math and reading than students in primarily White schools. Although this case required LAUSD to uphold a consent decree where they would outline plans to alleviate the inequalities present within the district, the LAUSD legal department indicated they had no obligation to keep the school board updated on the Rodriguez case and subsequently released no reports regarding the progress on such an issue. The legal team in LAUSD only expanded after the consent decree, mainly to protect the district from liabilities rather than address the needs of the children attending these schools. To this day, LAUSD students within low-income neighborhoods do not have enough funds to maintain school facilities or hire better teachers. The money allocated and distributed by the government consistently goes to higher-performing schools rather than the neediest schools, failing to provide necessary quality education to low-performing schools. This scarcity in education disproportionately affects non-White students within LAUSD. In a paper published by the Speak Up Parents Organization within LAUSD, it was noted that one-third of African American students were less likely to achieve proficiency in ELA (English Language Arts) on the Smarter Balanced test, they were 3.4 times less likely to achieve proficiency in ELA and math in comparison to their peers, and the gap between African American and White students ranged from 28% to 40%. These figures clearly show a discrepancy between White students and African American & Hispanic students. In addition to being present in LAUSD, this issue is one that plagues American education across the nation.
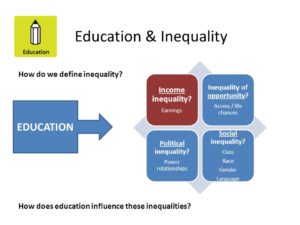
Inequality has been at the center of American economic and social issues. This can especially be seen in rising income inequality among races, an issue that affects individuals in very real ways. These effects are particularly present in the quality of high school and collegiate level education among the spectrum of income. There is significant inequality between racial groups, with White and Asians being classified as the highest income groups and African Americans, Native Americans, and Hispanics qualifying for the lowest income groups (Akee & Jones and Porter, 2019). Familial income has a significant role in school readiness and long-term success in school. Due to this, children attending schools with low-income classmates have worse academic performance and graduation rates compared to children attending schools with more affluent classmates (Duncan & Murnane, 2014). There are major discrepancies among racial groups in academic performance. A majority of racial minorities attend schools with low funding and have less access to educational resources in comparison to White students (Darling-Hammond, 1998). Further, the educational gap in relation to income has a direct effect on collegiate education, for there has been an association between collegiate inequality and income inequality, especially in recent decades (Micelle & Holzman, 2020).
LAUSD schools are funded by the state, mainly from income and sale taxes as well as local property taxes. Thus, a majority of the funding for LAUSD schools are based on the local environment that students live in. The national issue of educational inequality and discrepancies in academic performance amongst racial groups can be seen within LAUSD. For this article, I analyzed the most recent open source data demographics for each of the seven board districts within LAUSD and used statistical analysis to identify five major outcomes regarding race and income. Using data on the percentage of economically disadvantaged students and the rates of college completion within six years, I found a statistically significant negative correlation. This implies that as the percentage of economically disadvantaged students increases, the rates of college completion within six years decreases. Further, observing data on the percentage of non-White students and the rates of college completion within six years, I found a statistically negative correlation. This indicates that as the percentage of non-White students increase, the rates of college completion within six years decreases. In addition to this, using data on the percentage of non-White students and four year cohort dropout rates, I was able to find a statistically significant positive correlation. This suggests that as the percentage of non-White students increase, the four year cohort dropout rates subsequently increase. Moreover, when utilizing the percentage of non-White students and the percentages of students chronically absent, there was a statistically significant positive correlation. This notes that as the percentage of non-White students increase, the percentage of students grades 9-12 chronically absent increases as well. Finally, when testing both the percentages of students grades 9-12 chronically absent and the rates of college completion within six years, there was a statistically significant negative correlation. This means that as the percentage of students grades 9-12 chronically absent increases, the rate of college completion within six years decreases. These figures indicate that students who attend majority non-White schools are less likely to enroll or stay in college, drop out within four years of their high school experience, and be chronically absent from grades 9-12 than their majority White counterparts. Further, students who attend schools with high percentages of low-income families are less likely to enroll or stay in college than their higher-income counterparts, with chronic absenteeism from grades 9-12 being a factor in lower college enrollment and persistence. These outcomes clearly indicate that non-White students, particularly Hispanic and Black students, and lower-income students are at a disadvantage to their White, higher-income counterparts in regards to higher education. This was clearly evident in the difference in educational experience between students that attended schools on opposite ends of the racial and income spectrum.
One student, identified as Ash, attending a school in Board District 6 – a district with the second highest Hispanic population, highest percentage of economically disadvantaged students, lowest college enrollment and completion rates – noted how his school’s resources and funds were used in unproductive ways, explaining, “I feel like our funds could have gone towards many other things such as sports, more teachers, more academies.” When asked about his peer’s living situations in regards to their educational experience, he also noted how, “Some people have terrible living conditions or sometimes they have siblings they have to deal with. For example, I have a little brother and sometimes I gotta help him. And with athletics and everything, I gotta be home at, like, 6:00 or 7:00. And trying to get my homework done and my siblings – it’s kinda difficult sometimes.” He also commented on the lack of counselors, college visits, and tutoring within his school. This has had an impact on his higher education aspirations. When asked about if his school was preparing him well for college he said, “No, not really, just a lot of general stuff, nothing specific that helps you towards your degree. I mean, as I said earlier it’s a lot of information to be processing in a day.” Ash also observed how many of his peers applied and attended community college due to the high cost of universities or four-year colleges, saying, “Yeah, it actually does, like whether like if it was someone that was making more money they probably were able to go to a prestigious college rather than someone that’s a low income family, they probably go to a community college… It sometimes worries me thinking how much the cost of education will be, if I can afford it.”
The difference between Ash’s experience and that of another student who lives in Board District 6, a district with the highest college enrollment and completion and White enrollment, and the lowest percentage of economically disadvantaged students, is clear. The student, Tara McKillop, noted how a majority of her teachers were well-qualified, stating, “Of the teachers that are my favorite, they have engaged the students in learning and stuff like that, but they’ve also shown that they prioritize the student’s education and also emotional status too. I would also say that with those teachers that they are overqualified in the sense that they could be doing so much more than just teaching and we, the students, show that we are really grateful for that. We do have a good amount of APs offered at our schools and the teachers for those are really nice.” She also noted how a lot of the AP classes were filled with White and Asian students, rather than Black or Hispanic. When asked about the support that she receives for her high school education, McKillop stated, “Something that my school offers is lunch tutoring, by students for students. Some of my teachers also do provide tutoring and stuff like that so I think overall my school understands the kids’ situations.” She also stated how, “My parents do support me in my educational experience and I would say also my teachers have been a big influence on it. They’re there for the students to help them out with anything that they need.” When questioned about college preparation, McKillop noted how her college center has easily accessible resources and helpful college counselors. She also commented on the college educational aspirations and experiences of her peers, stating, “So the graduating class that I was close to, a lot of them got into Santa Barbara and San Diego. So, a lot of them are getting into UCs top colleges. I know quite a few of them were able to also go out of state.” This difference between Tara’s and Ash’s schooling and experiences towards higher education directly reflects the disparity that students within LAUSD experience.
This inequality in education continues to go unheard as thousands of students from similar backgrounds as Ash face similar obstacles and difficulties that other students simply do not experience. We must do a better job of being there for our kids.
Read More
2020 Election
by Sophia Mdinaradze, Milan Riley, and Ava-Ray Pributsky
The Election:
A presidential election in the United States is a democratic process held every four years in which all U.S citizens age 18 and older vote on the nominees for president, as well as a selection of each state’s Congressional representatives. The first election was held on Monday, December 15, 1788, and the most recent one was on Tuesday, November 3, 2020.
There have been 45 presidencies in total, and this is the 59th presidential election. Even when this election is over, the victor won’t officially become president until January 20, 2021, when the current President Trump’s term finishes. For now, Joe Biden will be President-elect until he is sworn in at his inauguration.
Before the voting began, each candidate attended several debates to explain their platforms and campaign points to the public. Let’s take a look at the candidates who ran for president or vice president.
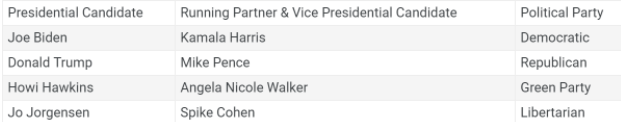
The Presidential & Vice Presidential Candidates:
There were 4 presidential nominees, along with their 4 vice presidential running mates. There were originally many more candidates throughout the primary process, though lots of them dropped out of the race earlier on: 27 Democrats and 3 Republicans in all. Here is a list of each major party’s final nominees, including their running mates and political party.
Voting:
The rules for the presidential election are different than other types of elections. For example, a student body election occurred recently at the Science Academy in which we voted for the ASB President, Vice President, Historian, Secretary, Treasurer, and Representatives. The candidates with the most votes won. However, the U.S. presidential election is run very differently. Our election uses something called the Electoral College. To be honest, it’s a pretty confusing and complicated process so here’s a basic explanation to understand what takes place:
The electoral college consists of 538 electors who formally vote for the president of the United States. Each state has a specific number of electoral votes based on their population and the number of Representatives in the House plus two Senators. A candidate must receive at least 270 electoral votes to win the election, and in general, a state’s electors are chosen based on who received the most votes in that state. However, it is possible that candidates can win the popular vote but lose the election if they don’t reach 270. For example, in 2000 Democrat Al Gore won the popular vote in the election, but Republican George Bush won the electoral vote.
When everyone in a state has voted, the candidate that receives the majority of votes receives that state’s electoral votes in a winner-take-all result, with the exception of Maine and Nebraska, who allocate electoral votes via districts. The Electoral College meets in December to cast the votes determined by their constituents. Here is an illustration of each state’s electoral votes:

Each state determines the process and method for voting, usually administered by their Secretary of State. Some states use paper ballots while others have voting machines. Some states, like Oregon and Colorado, have gone to 100% mail-in balloting.
Even though a lot of states vote differently, before Covid-19, most citizens voted at their nearest voting location in person on Election Day. However, citizens who could not go in person this year due to the pandemic could apply for an absentee ballot in many states, which is a ballot sent and returned by mail. For the 2020 general election, as a response to Covid-19, every registered voter was sent a ballot by mail in some states such as California. Once finished with the ballot, citizens either mailed them back or dropped them off in a drop box or at a voting poll location. Some states had early voting, while others only allowed voting in person on Election Day.
Since the pandemic encouraged many more people to vote by mail as a safety precaution, it was very important for citizens to turn in their ballots early on to ensure all the votes could be received in time to be counted. This year, 65,487,735 people voted by mail while only about 33,000,000 people voted by mail in 2016.
Result Process:
The unprecedented number of mail-in ballots made the election a bit more complicated this year. Different states had different deadlines for receiving the ballots, as well as differing rules as to exactly when the ballots could be processed so it was impossible to predict how a state would vote until a long time after the polls closed on Nov. 3rd.
The polls started to close in the East first, since it is ahead by three hours there. Around eight P.M, November 3rd, polls started to close in many western states, too. By this time, news channels already began projecting electoral votes based on states’ voting history and which candidate they were currently leaning towards.
There were several swing states that couldn’t easily be put in the blue (Democrat) or red (Republican) columns. These included Florida, Georgia, Michigan, Wisconsin, Pennsylvania, Ohio, and Arizona. Fairly early in the night, it was announced that President Trump had gained Florida’s 29 electoral votes and Ohio’s 18 votes. Adding these to the states already called, Trump took an early lead. The counting continued for several days as the nation awaited the results. Minnesota and Michigan were called for Biden, while Texas and South Carolina were called for Trump. In fact, one state, Georgia, was projected by several outlets to have gone for the Republican, but as the count continued, it had to be uncalled and later was called for the Democrat. Once Arizona, Wisconsin and Pennsylvania were called for Biden, Joe Biden was named President-elect and Kamala Harris was named Vice President-elect. Votes are still being counted, especially in large population states like California and New York, and President Trump is currently contesting the election procedures in certain states in court, but most observers do not expect the results to be changed.
After Biden got the electoral college votes from Wisconsin and Michigan, he only needed to win 6 more electoral votes from a state to obtain the next presidency. On the morning of Saturday, November 7th, Biden had taken the lead in Pennsylvania. Since the count there had almost finished, Biden was projected to be the 46th President of the United States.
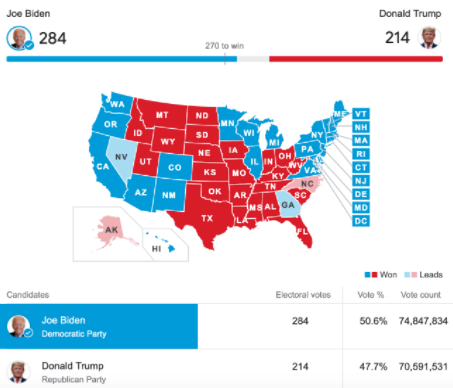
[Image from 11-07-2020 at 8:37 AM]
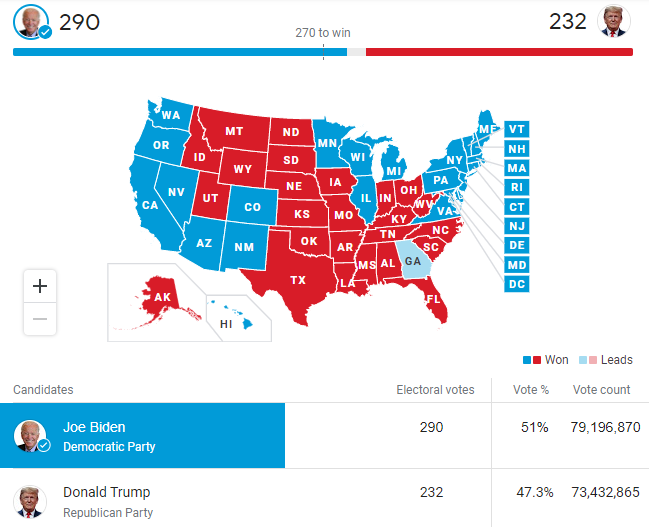
With all these state’s electoral votes, Biden had 284 electoral votes to Trump’s 214. Exceeding the amount of votes necessary for winning, which was only 270. This made Biden the official President-elect. Ultimately, after the count was finished in Nevada, Georgia, and North Carolina, Joe Biden received 290 electoral votes and Donald Trump received 232.
State Summary:
Flip States:
- Wisconsin, red to blue
- Michigan, red to blue
- Pennsylvania, red to blue.
- Georgia, red to blue
- Arizona, red to blue
Battleground States:
- Nevada, blue
- Colorado, blue
- Texas, red
- Iowa, red
- Minnesota, blue
- Wisconsin, blue
- Michigan, blue
- Ohio, red
- Florida, red
- Pennsylvania, blue
- Virginia, blue
- New Hampshire, blue
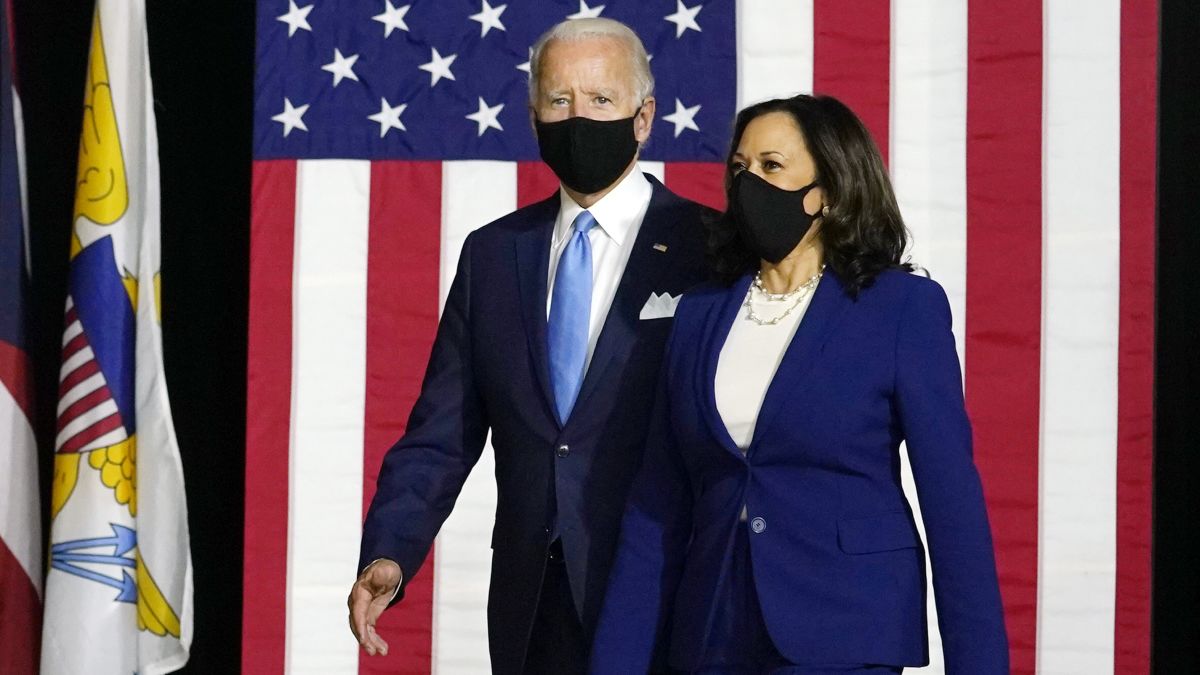
The President-elect & Vice President- elect Address the Nation:
When Biden was projected to be the winner on Saturday, November 7th, he and Kamala Harris gave an address to the public in Delaware. Biden said that it was “time to heal America” and stated, “I pledge to be a president who seeks not to divide but unify, who doesn’t see red states and blue states, only sees the United States.”
The Vice President-elect said, “While I may be the first woman in my office, I will not be the last, because every little girl watching tonight sees that this is the country of possibilities.” When becoming Vice President-elect, Harris broke several racial and gender barriers, inspiring many people: she is the first woman, the first person of African descent, the first person of East Asian descent, and the first child of immigrants to ascend to the office of Vice President.
Sources:
The Associated Press:
Ballotpedia:
https://ballotpedia.org/Main_Page
CNN:
https://www.cnn.com/election/2020/results/president#mapfilter=keyrace
The Washington Post:
https://www.washingtonpost.com/elections/2020/11/07/trump-biden-election-live-updates/
270 to Win:
https://www.270towin.com/states/
Wikipedia:
List of United States presidential elections by popular vote margin
YouTube:
Does your vote count? Electoral College explained – Christina Greer
Electoral vote vs. the popular vote: explained | Just The FAQs
Read More